Une série de tableaux pratiques sur le changement climatique
A bunch of handy charts about climate change
A couple dozen pictures are worth a couple thousand words.

13 FÉVR. 2024

One big difficulty in addressing climate change is that there are a lot of bad sources out there, throwing around a lot of bad information. Lefty climate activists — the people most inclined to spend their time and effort trying to do something about the problem — tend to get their information from quasi-leftist sources, who tend to make silly claims like “100 companies cause 70% of global emissions”, or “the richest 10% of people are responsible for half of emissions”, and so on. Then there are the right-wing types, who used to be into denying climate change, but who nowadays tend to throw up a giant cloud of FUD — for the non-finance types, that’s “fear, uncertainty, and doubt” — about green energy. The whole thing can get absolutely exhausting. The result, I think, is that much of the populace sort of tunes the whole climate debate out.
What’s really frustrating about this state of affairs is that there actually are quite a few excellent sources of information out there. Four of my favorites are Nat Bullard (formerly of Bloomberg New Energy Finance), Zeke Hausfather of Stripe and CarbonBrief, Hannah Ritchie of Oxford and Our World in Data, and Jesse Jenkins of Princeton. If you really want to know what’s going on with the climate, I recommend starting off by following those four people’s work. But they’re far from the only ones putting out good information — publications like The Economist and international organizations like the IEA have a ton of great resources as well.
Anyway, this is one of those issues where pictures really can tell most of the story. A lot of interesting charts about climate change and green energy have come out recently, and I thought I’d do a post where I just highlight a bunch of my favorites and talk a little about the implications. Basically, I see five key facts jumping out at me:
- Climate change is starting to get severe.
- Climate change is manageable, but we’re not there yet.
- The U.S. and Europe are no longer the biggest problem.
- Green energy is for real.
- Cutting emissions doesn’t require degrowth.
So without further ado, let’s get on to the charts.
Climate change is starting to get severe
Remember a few years ago, when every time there was a cold winter day, someone would pop up on Twitter to make fun of the idea of global warming? 2023 basically put an end to that. This was by far the hottest year in any of our lifetimes, or in the history of modern humanity. 2023 allowed us to experience what the world will be like at 1.5°C of warming — the level that the Paris treaty had tried to keep us under:

Here’s another good chart that shows how this progressed over the course of the year. 2023 started out unusually hot, but in summer and fall it just blew away everything else we’ve ever seen:

This doesn’t mean the world has already warmed past 1.5°C — for that threshold to be officially passed, it has to stay there year after year. With a little luck, temperatures will bounce around a bit, and 2023 will have proven to be unusually scorching. But the upward trend in yearly temperatures is unmistakable, and 2023 helped to quiet even the most dedicated doubters.
Of course, for years, we’ve been told that climate change is going to eventually start melting ice on Antarctica, raising sea levels around the world. Well, that’s only happening a little bit so far. But the sea ice around Antarctica melted to an unprecedented degree in 2023:

We’ve also been told to expect more natural disasters as a result of climate change — wildfires, coastal flooding, river flooding, severe heat waves, storms, and so on. Well, that’s now happening as well. There’s been a strong upward trend in the number of billion-dollar disasters (yes, this is adjusted for inflation) since at least the late 2000s:

Over the long run, an increase in costly disasters comes partially from the fact that richer countries have more infrastructure to damage. But a steep rise in disasters over just a couple of decades has to be almost entirely due to a more dangerous natural environment.
Obviously climate change isn’t the only reason for natural disasters — bad forest management and urban sprawl contribute to wildfire losses, coastal overbuilding makes cities more vulnerable to floods, and so on. But we didn’t suddenly start getting steadily worse at building to resist nature.
In other words, climate change is real, and it’s getting increasingly severe. People may feel exhausted by the debate, but the problem won’t go away just because we stop paying attention. As things get worse, more of our houses will burn or flood or get blown down. So for our own sake, we had better act to stop climate change before it gets even worse. 2023 was a warning we can’t afford to ignore.
Climate change is manageable, but we’re not there yet
Climate change is almost entirely manmade; emissions of carbon dioxide and methane cause it. The more we emit, the more climate change we get.
But over the past few decades, several very good things have been happening. First, humanity has been inventing technologies that replace fossil fuels — the main ones being solar power and rechargeable high-performance batteries. This creates a natural incentive to emit less. Second, countries around the world got together in the early 2010s and set out national targets for emissions reductions; this was followed in the late 2010s by various individual national pledges to reach “net zero” emissions by a certain date. And third, the U.S. has been switching from coal power to natural gas, which emits less CO2 (it emits more methane, but this can be easily dealt with, and it leaves the atmosphere fairly quickly).
These three facts led climate modelers to get rid of some of the apocalyptic scenarios they had been working with. They now think the most likely scenarios have the world warming somewhere between 1.5°C and 3.9°C. The forecasts say that the most likely outcome is around 2.6°C if we do nothing with policy and simply let the march of green energy take its course. If countries meet their Paris commitments, it’ll be a little lower — maybe 2.4°C. But if countries actually follow their boldest pledges, we could end up holding warming all the way to 1.7°C. Here’s a great chart by Zeke Hausfather, pulling together three different projections:

Here’s an alternative chart that shows the same thing as the blue column on the chart above, but with more explanation and detail:

And here’s a chart showing what emissions would look like under the baseline scenario. Emissions would remain essentially flat through the mid-century, then decline:

The difference between 1.7°C and 2.6°C is hard to put in a graph. To a regular person, that might sound like a small or even meaningless distinction. But in fact, a difference of 0.9°C is pretty huge, as climate impact goes. CarbonBrief has a good rundown of expected differences between 1.5°C and 2.0°C., and there are various other explainers around the Web. That difference is pretty big. But there’s little information out there on temperatures in the 2.5°C, and given that that’s where we’re headed right now, it seems like this is a gap in climate communications. We need more explainers of what a 2.5°C world would look like, and how much worse it would be than a 1.5°C world.
The U.S. and Europe are no longer the biggest problem
As I mentioned, climate change is almost entirely manmade. But where do those emissions come from? In terms of CO2, the biggest chunk comes from burning coal — for electricity, for heat, and for industrial processes like making steel. Coal is especially bad for climate change, as it gives off more CO2 than other types of fuel. Oil, which is mostly used as transportation fuel, comes in a close second.
The good news is that emissions from global coal use have leveled out. And this has caused overall emissions growth to slow a lot since 2010:

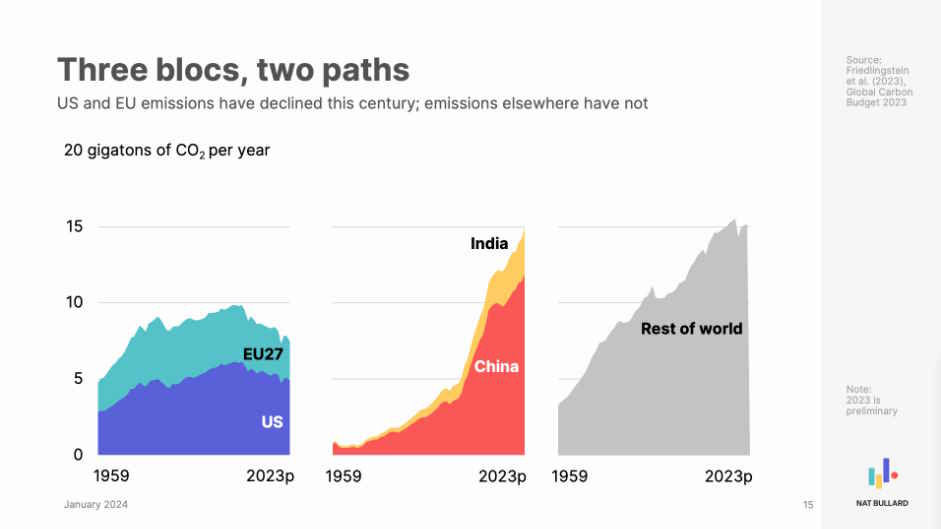
Now for the bad news. The U.S. and Europe have been making big strides in reducing CO2 emissions. Little or none of this came from offshoring manufacturing to Asia. But at the same time, emissions in China and the rest of the world have soared, and now utterly dwarf the U.S. and EU:
China is by far the worst offender, opening a large number of new coal plants, in defiance of its own climate pledges. The developed democracies aren’t constructing new coal plants at all, and developing countries other than China are now building very little:

Of course, China is also the world’s main builder of green energy, especially solar panels and batteries. That’s good. But as long as China continues to burn massive amounts of coal — which is related to its own political incentives and industrial policies — climate change will continue getting worse. Obviously the U.S. and Europe should continue reducing their own use of coal and oil. But without China (and Southeast Asia) on board, the West’s efforts may simply be canceled out.
Lefty climate activists get really mad when you mention this fact, but it’s true. And it’s not immediately clear what the developed world can do to influence China’s behavior. Carbon tariffs would be a good start, though. There are other ideas, such as buying up coal from exporters like Indonesia and leaving it in the ground, so that China can’t burn it. Anyway, this is a topic for a longer post.
Green energy is for real
Our best hope for beating climate change — and the reason the picture has brightened so much in recent years — is technology. Solar power and battery storage are on steep learning curves, meaning that the more of them we deploy, the lower they cost. Batteries are particularly important because they have two main uses: to replace oil as a power source for transportation (electric vehicles), and to help solar and wind replace coal by smoothing out intermittency.
Let’s start with solar and wind. At this point, thanks to massive volumes of Chinese production, solar panels are so cheap they’re practically free. Costs for land and installation have been falling as well, though more slowly. Wind is also getting cheaper, though less quickly, and land costs are higher.
But anyway, because solar and wind are so cheap now, utility companies are starting to install them in large quantities. As of 2022, solar and wind were almost one-eighth of global electricity generation, and 2023 is going to show another large increase:

This really looks like an unstoppable rise. In fact, solar and wind are expanding faster than either nuclear power or liquified natural gas did:

Anyway, on to batteries. As everyone knows, solar and wind are intermittent. Usually you can just fix this with a natural gas peaker plant, which only turns on when the solar and wind run out. That produces some emissions, but a lot less than just using natural gas to power everything. But a much better solution is just to have a bunch of batteries to store excess solar energy during the sunny hours (or wind energy during the windy hours) and then use battery power when solar and wind aren’t available.
There have been a lot of arguments about whether battery storage for the electrical grid will ever be cost-effective. But when we look out at the world, we see battery storage increasing at what looks like an exponential rate:

Of course, batteries are also useful for electric vehicles. And here too, cheaper batteries — along with the natural advantages of electric cars, such as faster acceleration and much less need to visit a filling station — are leading to exponential growth:

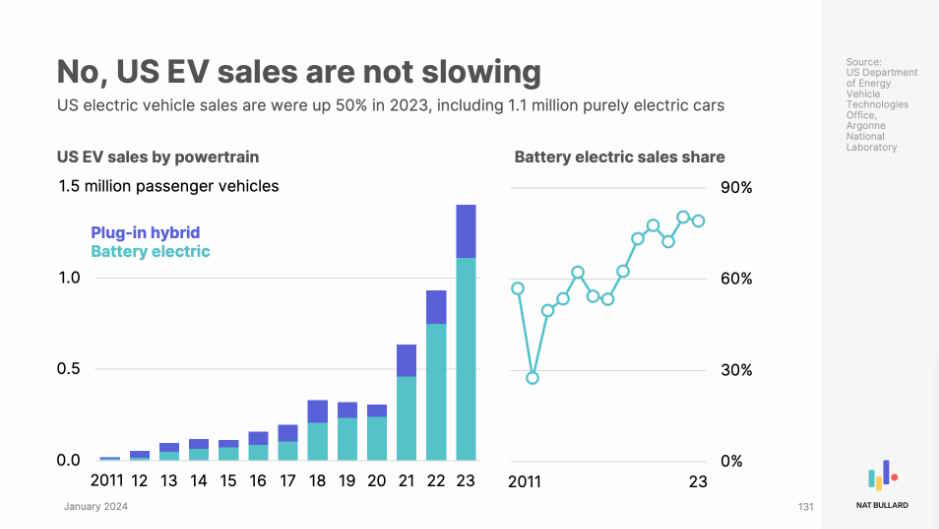
This year there were a flurry of stories about how the EV revolution was stalling out in the U.S. So far, those stories have proven inaccurate; the EV transition is continuing to accelerate in America:
It’s also worth mentioning that the green technology revolution is being driven by fundamental technological improvements, not merely by subsidies or economies of scale. Yes, subsidies for green energy are good, because in order to beat climate change we need to install green energy even faster than the market otherwise would. But when you look at the technological capabilities of solar panels and batteries, you see that they’ve continued to get better and better.
First, here’s the number for solar panels. The efficiency with which they convert sunlight to electricity jumped all the way from 16.8% in 2018 to 21.3% in 2023:

For EV batteries, the key metric — or at least, one key metric — is energy density. Here, we see continuous improvements in the state of the art:

Meanwhile, another claim used to cast doubt on green technology is that there aren’t enough easily recoverable metals in the world to build the necessary batteries. As Hannah Ritchie writes, this is extremely unlikely. For example, here’s her chart for lithium:

She has more charts showing a similar pattern for every other critical mineral — copper, cobalt, graphite, nickel, and neodymium — but their pictures all look even more optimistic.
The realization that the world is full of lithium — the U.S. is finding absolutely massive amounts of the stuff — may be one reason why lithium prices have collapsed so hard over the last few months:

Some people are also worried about the waste generated by used-up solar panels, wind turbines, etc. But this isn’t much of a concern; the waste is very small relative to coal power:

In any case, I think your takeaway from all of this should be that green energy is very much for real, and not a fad being driven by environmentalists and government largesse. The tools now exist to solve the climate crisis; all we have to do is pick them up and use them.
Reducing emissions doesn’t mean degrowth
Finally, it’s worth talking about the effect that addressing climate change will have on the rest of the economy. Some climate activists think that giving up fossil fuels will require degrowth. The basic idea is that emissions and GDP are irrevocably coupled — that there’s no way to increase GDP over the long term while also giving up oil and coal and gas.
Fortunately, this is just wrong. A new IEA report shows global GDP increasingly uncoupled from CO2 emissions:

The decoupling is especially apparent in the U.S., the EU, and other rich countries:

And no, this is not happening because we outsourced emissions to China; that is a myth. When you look at consumption-based emissions, you see very little offshoring of emissions by the developed democracies:

In fact, when we look at China, we see a similar pattern playing itself out there — emissions are still increasing, but the divergence from GDP growth is absolutely massive.

Only Southeast Asia and the Middle East, of all world regions, haven’t seen this decoupling yet.
In other words, the future of the human race looks OK — at least, as far as climate change is concerned. With the magic of solar and batteries, we can keep civilizational progress humming while also reducing our destructive impact on the Earth’s climate. Yes, there are still some big hurdles out there — the Chinese coal industry, Middle East profligacy, NIMBYs in the U.S., and so on. But in stark contrast to 15 years ago, we now possess the tools to get the job done.